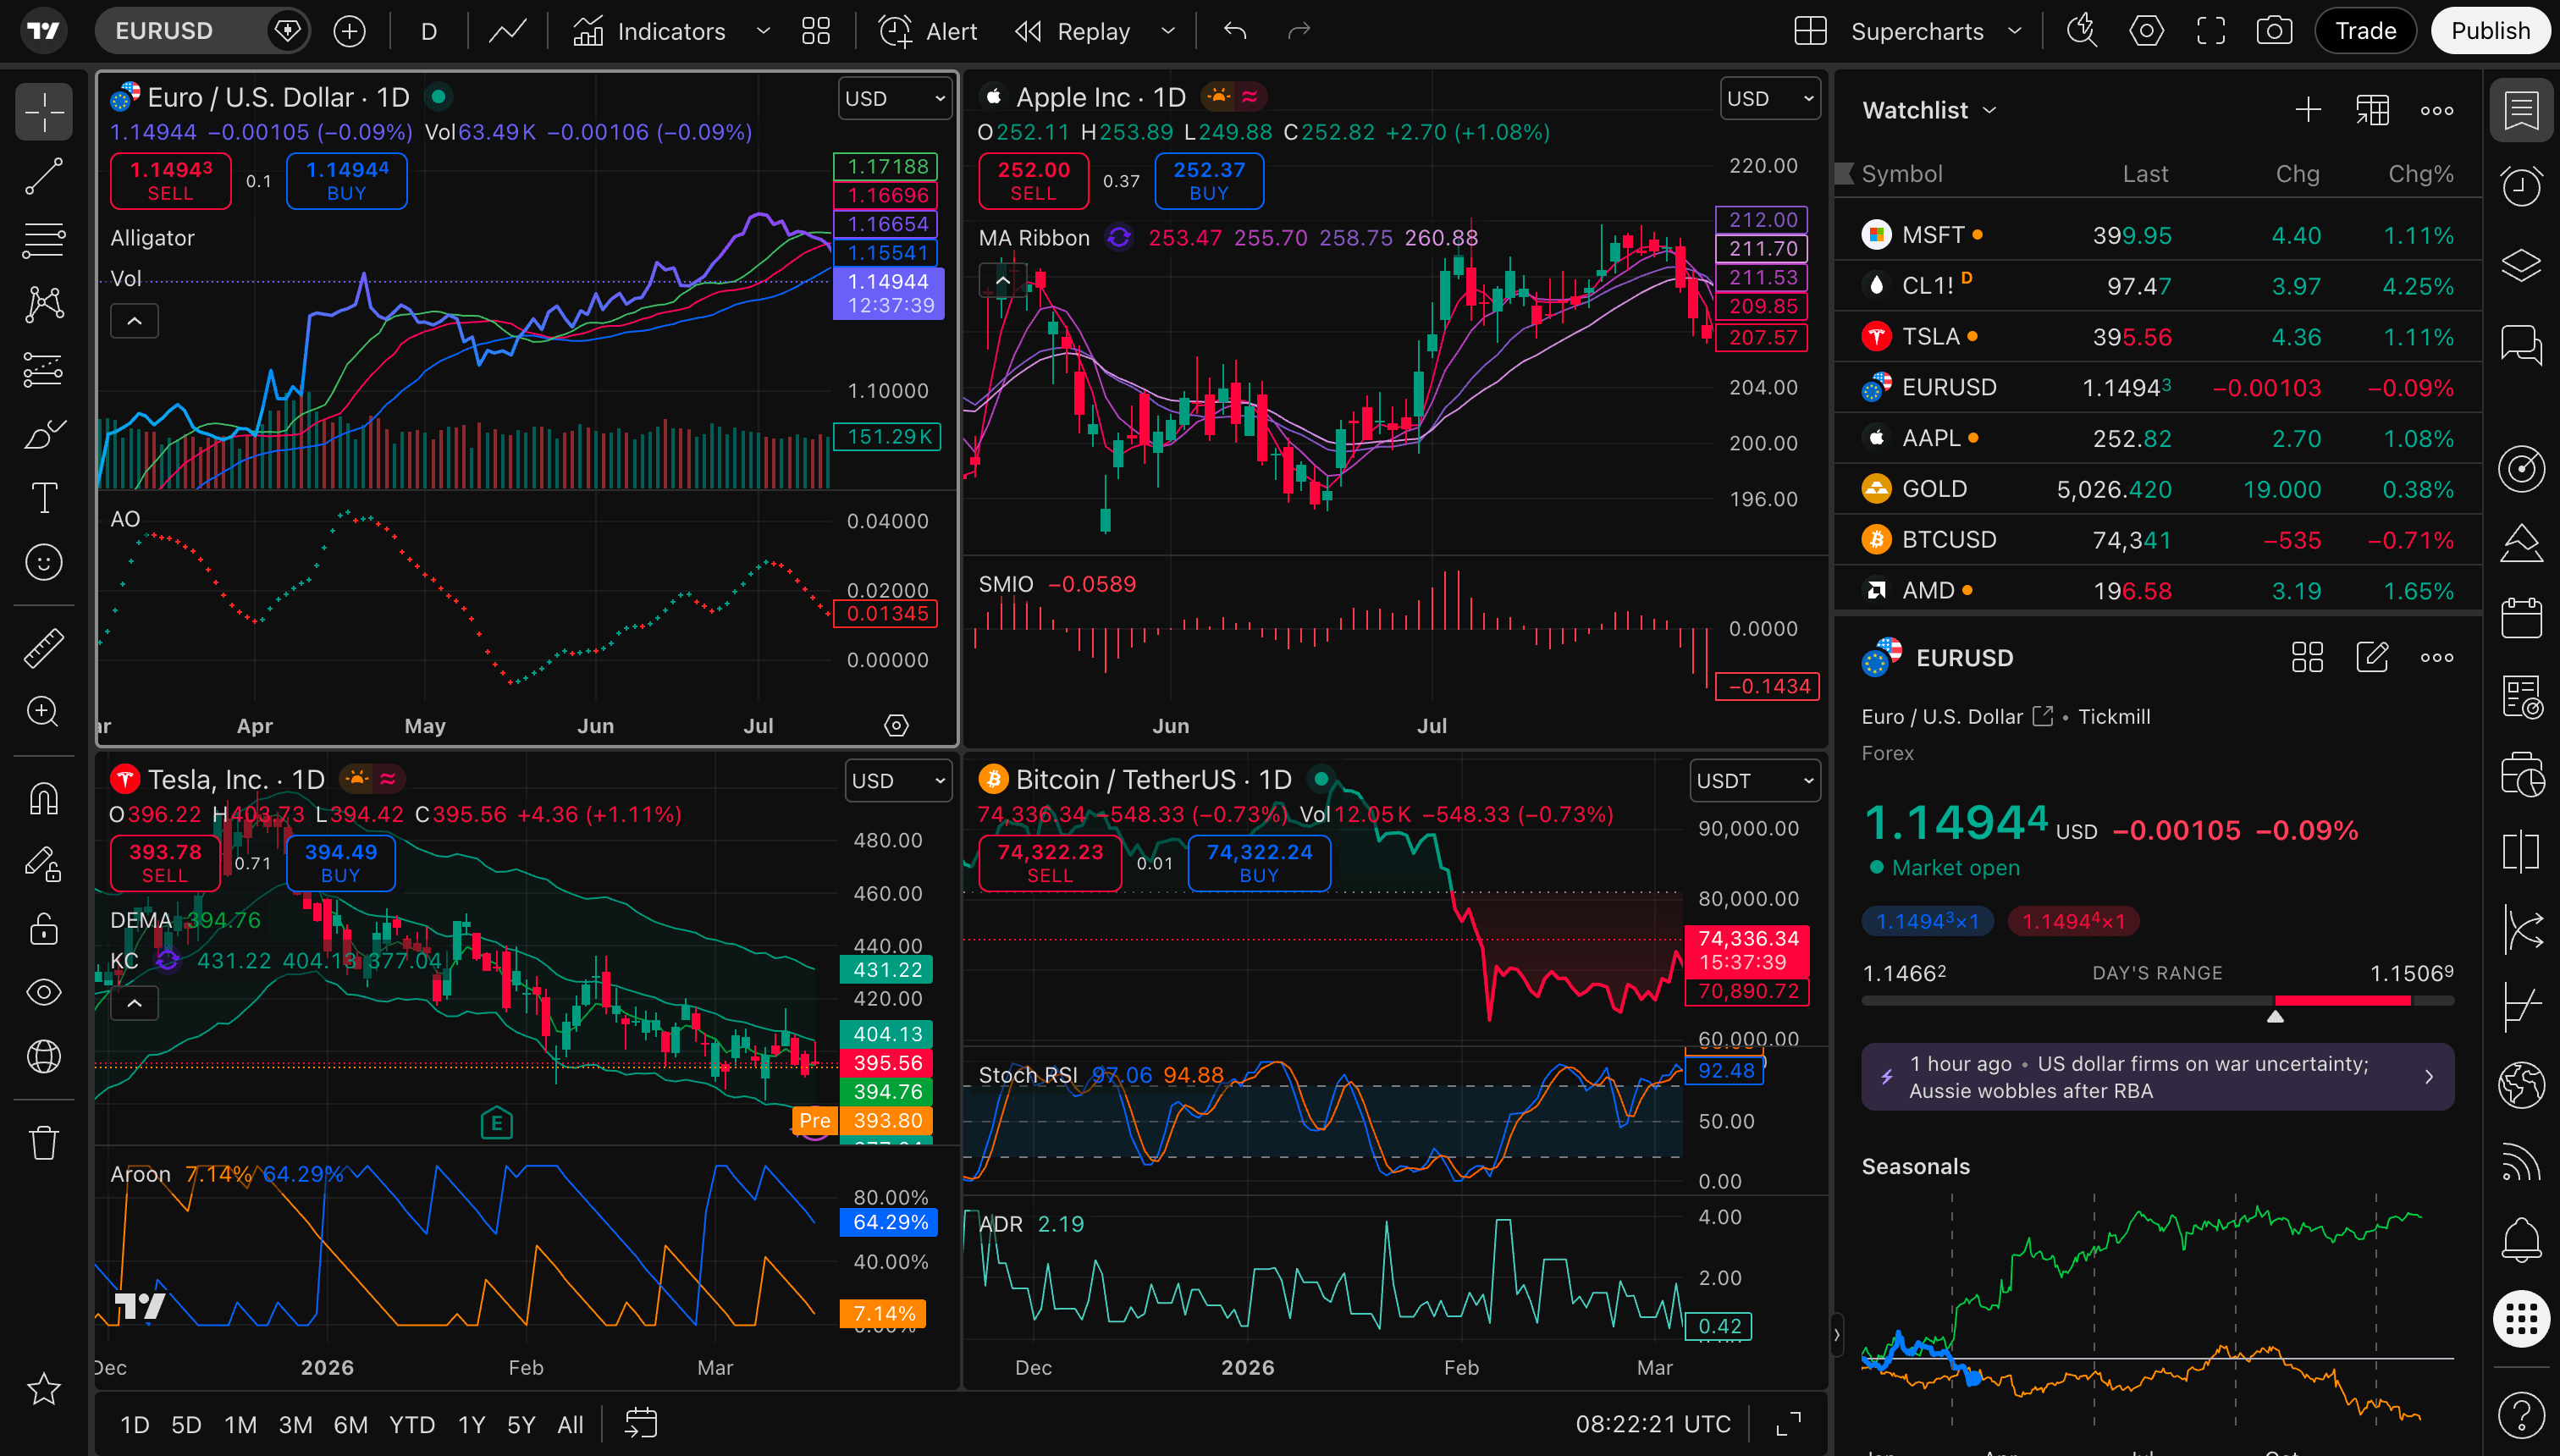
Most charting screens fail because they try to show everything at once: five overlapping oscillators, default gridlines, and intraday noise that obscures the broader structure. Good charting is an exercise in subtraction. Here is how to set up TradingView so that price structure, key liquidity levels, and server-side alerts do the heavy lifting for you.
Start with a clean canvas
Open a new chart layout and strip away the default visual clutter before adding a single indicator. Right-click the canvas, open Chart settings, and make three immediate adjustments:
- Mute the gridlines. Set vertical and horizontal grid opacity to under 5% (or off entirely) so horizontal support and resistance levels stand out immediately.
- Neutralize candle colours. Use calm, high-contrast hues (such as deep teal for up-bars and muted slate or rust for down-bars) to reduce emotional reaction to short-term spikes.
- Hide ticker watermark & status clutter. Keep only the symbol name, timeframe, and OHLC values visible in the top status line.

Logarithmic scales and timeframe alignment
Whenever you inspect more than six months of price history, toggle the price axis to Logarithmic (Log) in the bottom-right corner of the chart (or press Alt + L). A linear scale makes a move from $10 to $20 (+100%) look ten times smaller than a move from $100 to $200 (+100%). Log scale spaces equal percentage gains equally.
Indicators that earn their space
Every indicator added to a chart is derived from price, volume, or open interest. Limit your template to at most two complementary overlays:
- Anchored VWAP (AVWAP). Anchor it to major regime catalysts — earnings releases, Federal Reserve meetings, or 52-week highs — to see the exact volume-weighted average price paid by participants since that event.
- Average True Range (ATR). Use a 14-period ATR to size stops and position limits objectively relative to current volatility, rather than picking arbitrary percentage stops.
Let server-side alerts watch the tape
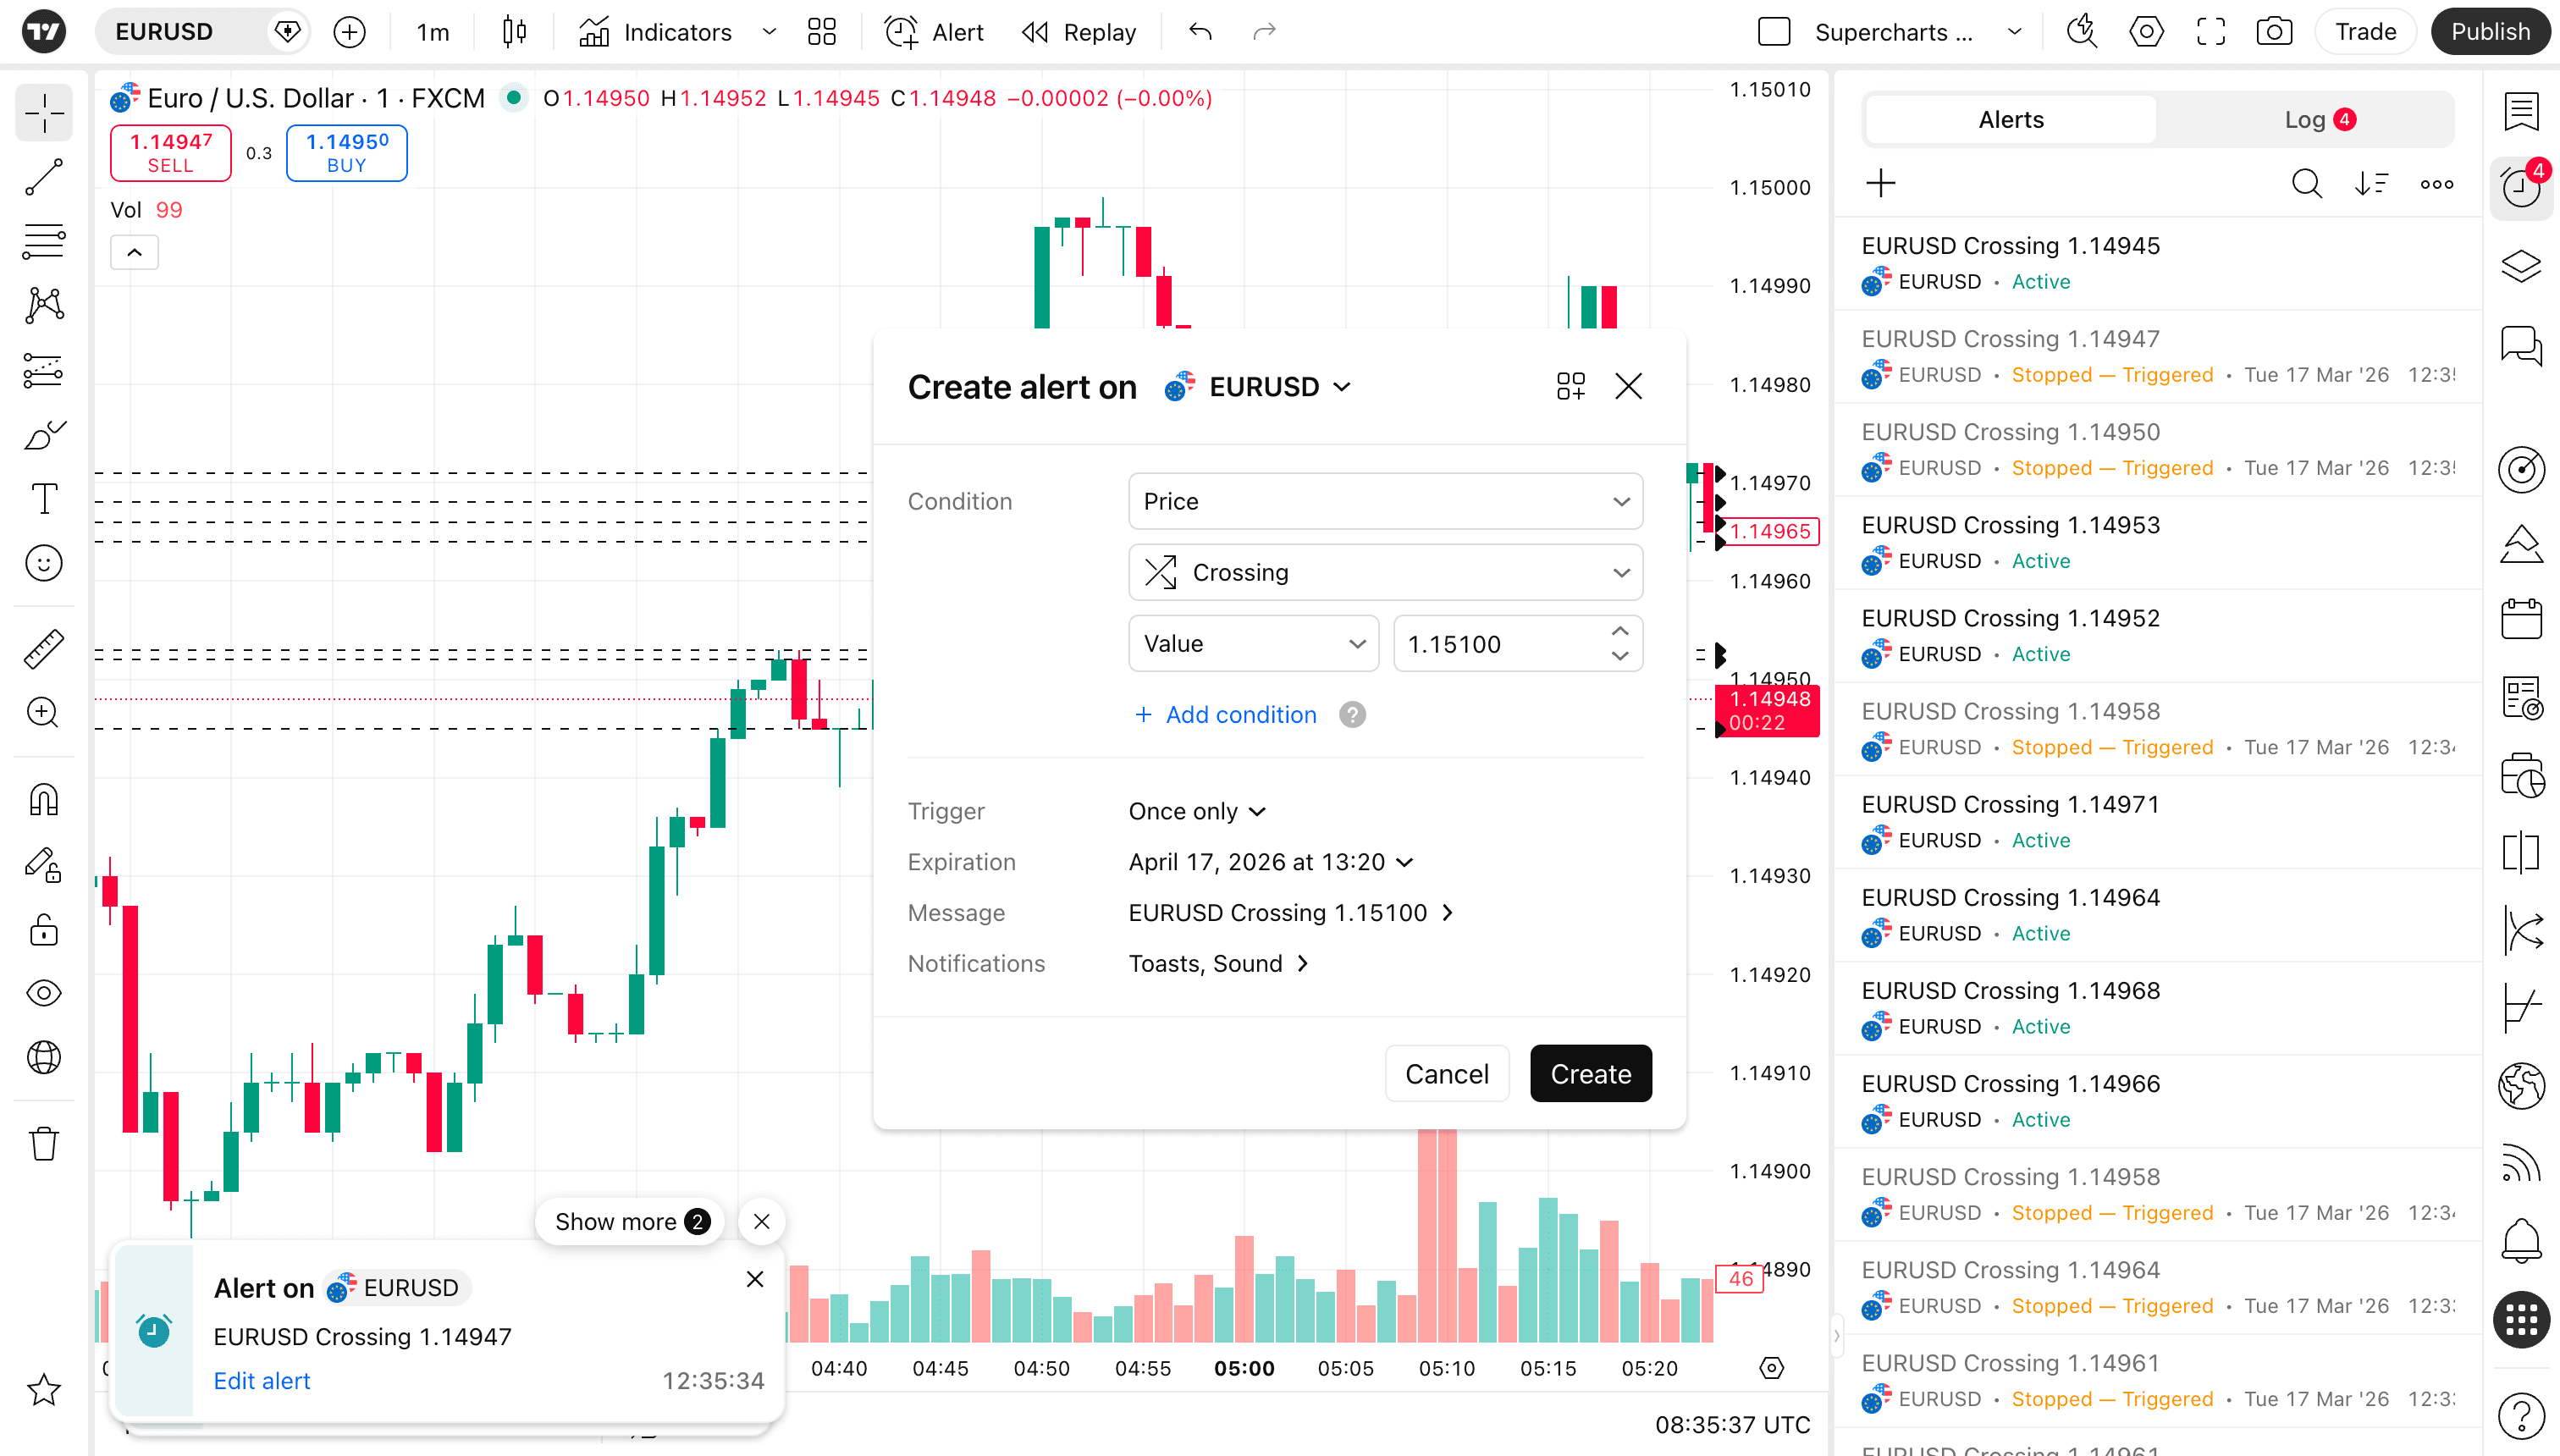
Staring at ticks all day is negative convexity: high time cost, high fatigue, and constant temptation to overtrade. Instead, right-click your horizontal level, select Add alert (Alt + A), and set the trigger condition to Once Per Bar Close.
Waiting for the bar close filters out intrabar wicks and only notifies you when the market has committed above or below your level.
What to take from it
- Remove visual noise first. If a line on your chart does not change your decision, delete it.
- Use logarithmic scales for multi-month trends and Anchored VWAP for event-driven cost basis.
- Automate patience with bar-close server alerts so you only act when conditions align.
Browser-based multi-asset charting, Pine Script backtesting, and server-side alert webhooks without terminal bloat.